The last full week of August saw the smallest increases since the start of the pandemic across virtually all departments. Prior months had shown weak final week of the month sales and, in this case, the results were further influenced by a much earlier Labor Day in 2019 that fell on September 2. That means the sales results of the week ending August 30th 2020 went up against the 2019 Labor Day sales. Labor Day has always been a massive holiday week for grocery — making it a much harder holiday to beat than ones that had more of a split retail versus foodservice nature in typical years, such as Mother’s Day. Additionally, sales were negatively affected by more extreme weather events, impacting large parts of Louisiana and east Texas.
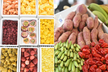
The net effect for fresh produce was a much smaller gain than those seen since the last week of June. For the week of August 30, fresh fruit and vegetable sales increased 4.7% over 2019. Frozen fruits and vegetables had a much higher percentage increase, at +17.7% but is the smallest of the three temperature zones. Year-to-date through August 30, fresh produce department sales are up 10.9% over the same time period in 2019. Frozen fruit and vegetables increased the most, up 26.8% year-to-date.
- Fresh produce increased +4.7% over the comparable week in 2019.
- Frozen, +17.7%
- Shelf-stable, +2.1%
Source: IRI, Total US, MULO, 1 week % dollar growth vs. year ago
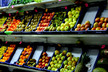
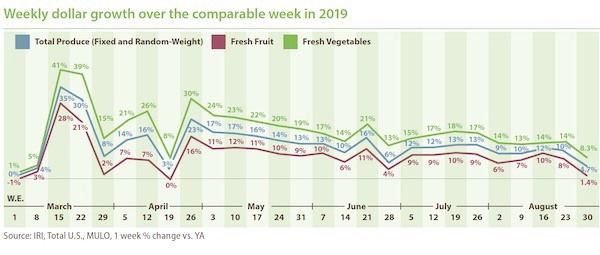
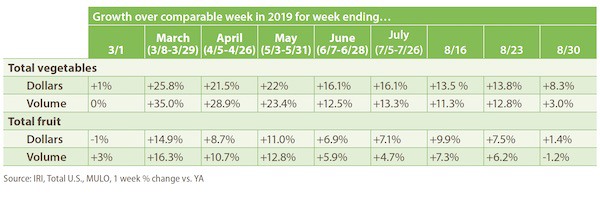
Fresh produce generated $1.26 billion in sales the week ending August 30 — an additional $56 million in fresh produce sales over the prior year. This is far below the pandemic average for additional dollars, at $179 million per week due to going up against the 2019 Labor Day performance. Vegetables grew 8.3% versus year ago and fruit dropped down to +1.4% during the week of August 30.
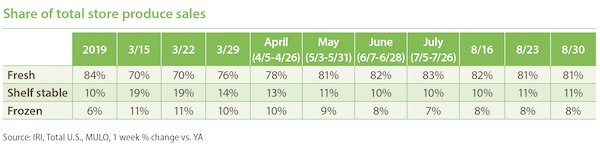
Fresh share
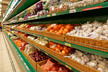
Fresh produce commanded an 81.4% share of total fruit and vegetable sales across all three temperature zones during the week ending August 30 — unchanged versus the week prior. “Frozen fruit and vegetables have gained share amid the pandemic despite still being down double digits in the average number of items per store on the fruit side,” said Jonna Parker, Team Lead Fresh with IRI. “Consumers are giving frozen fruits and vegetables credit for shelf life and that is an important lesson for us on the fresh side.”
Fresh produce dollars versus volume
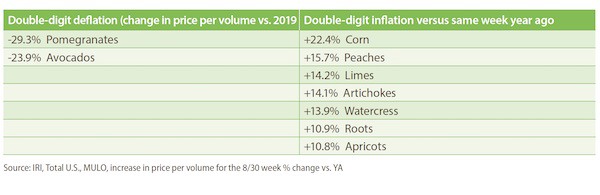
The week of August 30th experienced a 0.5% volume increase — 4.2 percentage points less than dollar gains. A look at category-level price information shows continued areas of high inflation and high deflation that, to an extent, are counterbalancing each other to result in fairly mild inflation.
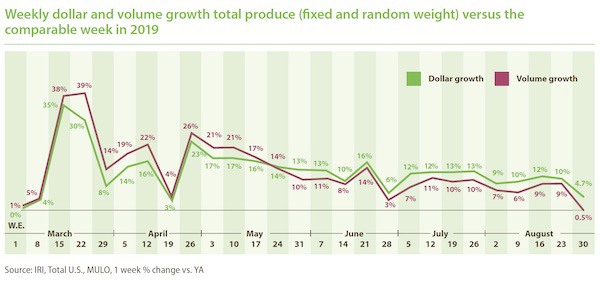
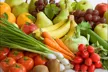
Both fruit and vegetables saw dollar sales gains track ahead of volume gains. Vegetable volume growth dropped to its lowest level, at +3.0% during the week of August 30th and fruit volume sales dropped below last year’s levels, at -1.2%.
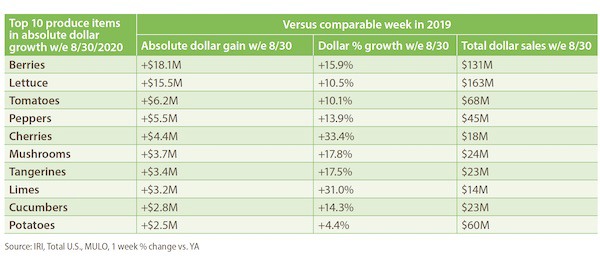
Absolute dollar gains
“Berries claimed the number one slot in the Top 10 absolute dollar gains for the third week in a row with an additional $18 million versus year ago,” said Watson. “But many others changed position, came into the top 10 or dropped out of the top 10. Tangerines were the fastest riser, jumping into sixth place with gains of $3.4 million.”
Many more fruits and vegetables had double-digit inflation versus deflation during the week of August 30. Corn led the list of items with inflation, at +22.4% versus year ago, followed by peaches and limes.
To read the full report, click here.
 For more information:
Anne-Marie Roerink
210 Analytics LLC
Tel: +1 (210) 651-2719
Email: [email protected]
www.210analytics.com