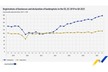
Using data from the ninth Credit Suisse Global Wealth report, the Visual Capitalist came up with an animated chart this week, ranking countries by average wealth, calculated as gross assets per adult citizen.
Related Articles → See More
-

"We still have the ability to export fertilizers"
-

Russia extends fertilizer export quotas as global supply tightens
-

Australian growers turn to stabilised nitrogen as supply tightens
-

Global fertiliser supply tightens as affordability pressures grow
-

Currency markets react to U.S.-Iran ceasefire uncertainty
-

Malaysian fertiliser supply hit by Russian and Chinese export curbs
-

South African farmers monitor rising fertiliser and fuel costs
-

Israeli fertiliser and packaging costs surge due to supply disruptions
-

New Zealand fertiliser supply secure for autumn period
-
EU business registrations up 0.5%, bankruptcies rise 2.5% in Q4 2025