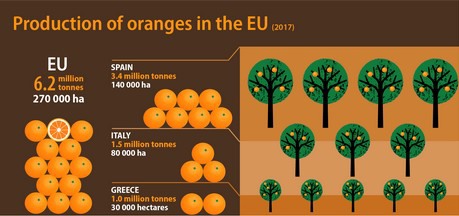
In the EU, 270 000 hectares (ha) were devoted to the production of oranges in 2017. Half of this area is in one Member State: Spain (140 000 ha, 52% of EU total). Italy has the next highest area given over to orange production (80 000 ha, 31% of EU total), followed by Greece (30 000 ha, 11% of EU total).
The EU Member States harvested 6.2 million tonnes of oranges in 2017. Spain accounted for over one half of the harvested production (3.4 million tonnes of oranges, or 54% or the EU total), followed by Italy (1.5 million tonnes, 25%) and Greece (1.0 million tonnes, 16%).
The source dataset is accessible here.
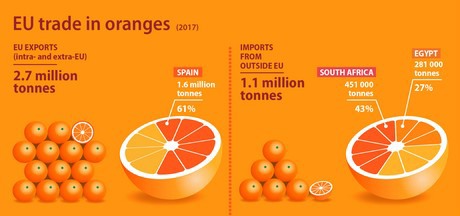
Majority of trade in oranges took place within the EU
Last year, almost 2.7 million tonnes of oranges, worth €1.9 billion, were exported by the European Union's (EU) Member States. Nearly 90% of these (2.4 million tonnes) were traded within the EU. Among the EU Member States, Spain exported the most oranges (1.6 million tonnes of oranges exported in 2017, or 61% of the total EU Member States exports).
The source dataset is accessible here.
Over 70% of oranges imported from outside the EU come from South Africa or Egypt
1.1 million tonnes of oranges, worth €697 million, were imported from non-EU countries. These oranges mainly came from South Africa (451 000 tonnes, or 43% of the total extra-EU imports of oranges in 2017) and Egypt (281 000 tonnes, 27%). They were followed at a distance by Morocco (121 000 tonnes, 12%), Argentina (39 200 tonnes, 4%), Zimbabwe (32 700 tonnes, 3%), Brazil (28 600 tonnes, 3%), and Uruguay (26 300 tonnes, 3%).
For more information:
Email: [email protected]