In the pre-pandemic period in 2018-2019, the median time spent in port – based on data from United Nations Conference on Trade and Development (UNCTAD) – was relatively stable around 16.5-17 hours. This then increased to 20 hours at its peak during the pandemic in the second half of 2021 and first half of 2022.
The pandemic disruptions and the increase in volumes, contributed to this rise in the time spent in port. Using a handling index (basically comparing the median time spent in port with the number of containers being shipped, with index 100 defined as 2018-1H), what we see is that when taking the global volume into account, the average time spent to load and unload an individual shipped container did increase significantly during the pandemic.
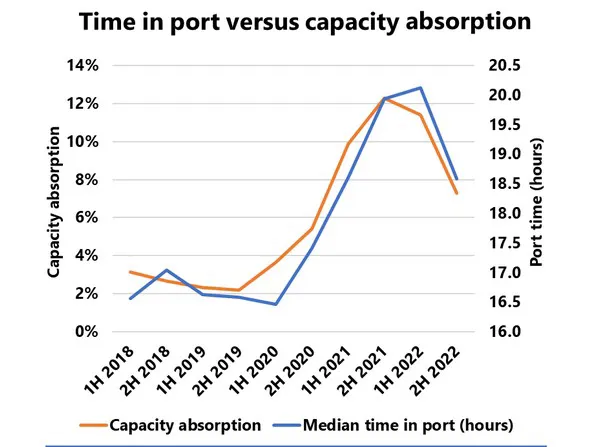
When we correlate this to our measure of capacity absorption i.e., the de facto vessel fleet that is not available to the market due to vessel delays, we see that there is a tight correlation between the two, and as such, the supply chain bottlenecks impacting the container fleet in reality also impacted the terminals in the same way. This correlation between the two measures is shown in the figure above.
With the median time spent in port as a base, we can augment it with our measure of capacity absorption to calculate the berth capacity absorption i.e., additional amount of berth capacity removed from the market due to longer port stays. We then tie that in with import and export volume data for North America and arrive at a berth congestion index for US.
US ports suffered from a much larger effect than the global average, which means that effective US terminal capacity available to handle vessels was severely impacted during the pandemic, touching 35% at its peak, which, interestingly, was reached in 2022-2H.
For more information:
Sea-Intelligence ApS
Vermlandsgade 51
2300 Copenhagen S - Denmark
ia@sea-intelligence.com
am@sea‑intelligence.com
nhm@sea-intelligence.com