A new Australian tree crop weather monitoring app has been able to track its first major weather event since launching.
The Applied Agricultural Remote Sensing Centre (AARSC) at the University of New England launched its "Australian Tree Crop Map: Severe Weather App" last year, which covers the growing region of many horticulture crops. Last week it was used successfully after North Queensland was hit by Tropical Cyclone Imogen.
"There was much excitement in the office as our app tracked its first tropical cyclone event, since launching in November 2020," Co-developer of the app, Craig Shephard said. "TC Imogen crossed the Queensland coastline just north of Karumba at 9pm Sunday 3rd January. It was downgraded to a tropical low on Monday 4th. The now ex-TC Imogen tracked east toward the major horticulture growing regions of North Queensland. Given the intense rainfall associated with the system, the BoM has issued numerous severe weather warnings (flooding) across the North Tropical Coast and Tablelands regions."
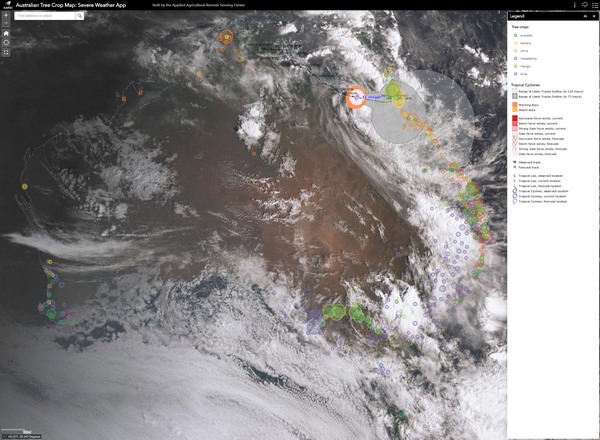
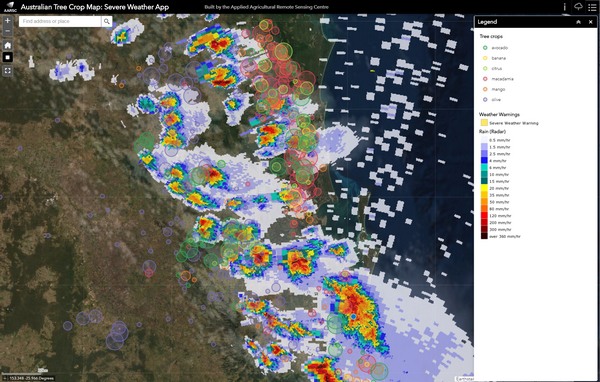
Photo: Tracking Tropical Cyclone Imogen
The layers for severe weather currently include tropical cyclones, thunderstorm, wind, rain (radar) and severe weather warnings. Mr Shephard says the app will be particularly valuable in this ‘La Nińa’ year when more severe weather events like tropical cyclones and heavy rain are expected.
"Typically for severe weather events the impacted areas are concentrated geographically," he said. "Through our map of horticulture tree crops we know many are concentrated in distinct growing regions, so the impacts of a single severe weather event can be significant. The app effectively overlays the maps of severe weather on top of our map of the tree crops, such that the potential impacts can be visually assessed, in near-real-time."
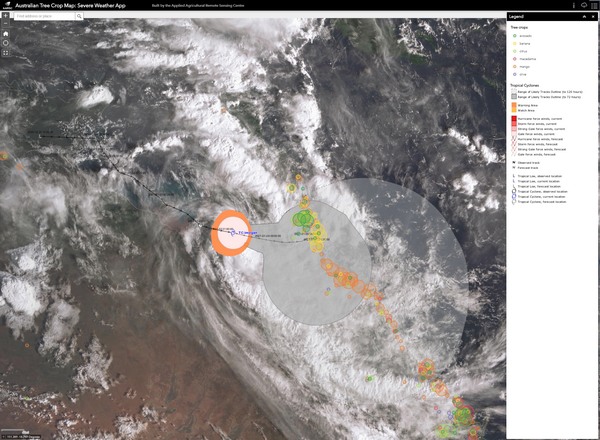
Photo: Tracking Tropical Cyclone Imogen
He added that the app does not show actual damaged crops, rather the likely area impacted, and the location of all commercial orchards in the ‘line of fire’.
"To understand the extent of tree crops potentially impacted, we can use our Dashboard app, which interactively presents the area of each tree crop across Australia,” Mr Shephard said. "Note the concentration of banana plantations in north Queensland, along with many avocado, citrus and mango orchards. The app presents spatial data in near-real-time, in an easily accessible, interactive and open format, available to everyone. The power of the app is in sharing location-based information to anyone, on any device and importantly for information that's constantly changing – the map is updated in near-real-time. At national scale (zoomed-out) the current satellite image of Australia shown, captured from the Himawari-8 satellite. It gets updated every 10 minutes."
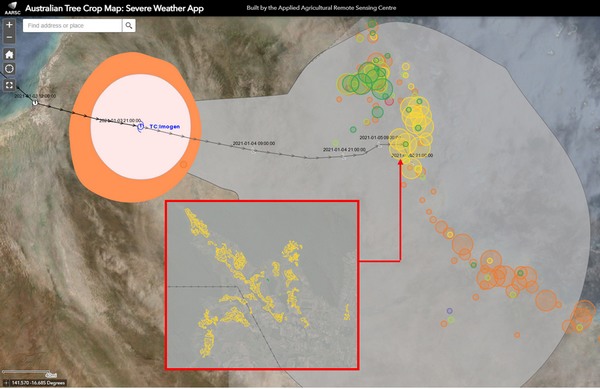
Photo: Tracking Tropical Cyclone Imogen
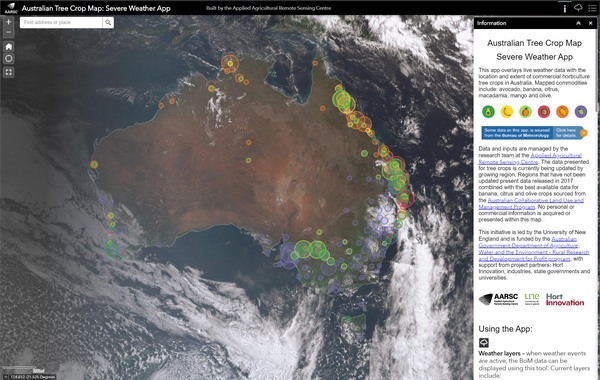
This app overlays live weather data with the location and extent of commercial horticulture tree crops in Australia and currently, the mapped commodities include avocado, banana, citrus, macadamia, mango and olive.
"The AARSC are currently updating this mapping across Australia, which is a component of two projects; 'Multi-scale monitoring tools for managing Australian tree crops — industry meets innovation' and “Implementing precision agriculture solutions in Australian avocado production systems," Mr Shephard said. "It could be extended to include other industries. Mapping agricultural land use at commodity level is challenging, we combine remote sensing data (imagery), and other ancillary data with extensive field validation to compile the map, built to national standards. We are very fortunate to have a great collaboration with the respective industry bodies to support the work."
The app has been viewed over 600 times since launching in November 2020 and Mr Shephard says the information for severe weather events is sourced as authoritative data from the Bureau of Meteorology, updated in near-real-time, such that decision-making for preparedness and in response and recovery can be informed with the best information available.
"Advance warning of severe weather conditions is one application but knowing which growing regions have been impacted by severe weather events enables the industry to quantify the impact area and what it means for future supply and demand. Post-event, the AARSC are undertaking further R&D to include additional layers for historical weather events, including the path and impact zones of tropical cyclones and severe thunderstorm cells. This information will greatly assist in analysing the area of impacts across tree crops in the days and weeks after events to assist in response and recovery efforts." Complimentary remote sensing research undertaken through the greater project is mapping tree health and yield for the various tree crops from satellite, it is therefore envisaged that estimates of lost productivity at the orchard, farm and regional scale can also be provided post-disaster.
The severe weather app will also help guide decision-making in the face of a significant severe weather event such as a tropical cyclone, according to Mr Shephard, who says growers can change their harvest logistics and labour requirements.
"This ultimately means that more produce can be picked before the destructive weather arrives, and removes their crop for them," he said. "This ensures that growers maintain a return on production and consumers aren’t exposed to a significant price increase due to reduced availability of produce, as seen with bananas following Cyclone Larry in 2006. Location is the foundation of all the information presented, the severe weather app brings the data together and presents it in a single 'map'. Through our research, the AARSC are using the benefits of web-enabled Geographic Information Systems to deliver this important information, in near-real-time. We are fortunate to have the support and collaboration of multiple partners and stakeholders including industry, academia and government."
This mapping is a component of two greater projects “Multi-scale monitoring tools for managing Australian tree crops: Industry meets innovation” and “Implementing precision agriculture solutions in Australian avocado production systems". These projects are funded by the Federal Government's Rural Research and Development for Profit scheme and Hort Innovation respectively. Both projects are led by the University of New England.
Users can launch a web app at: www.une.edu.au/webapps
For more information
Craig Shephard
Applied Agricultural Remote Sensing Centre
Phone: +61 2 6773 4085
aarsc@une.edu.au
www.twitter.com/une_aarsc