In recent weeks, grocery trips have come down while the average basket size is growing. Meanwhile, online grocery shopping continues to gain in popularity. All these developments have significant impact on fresh produce sales. 210 Analytics, IRI and PMA partnered to understand the effect for produce in dollars and volume throughout the pandemic.
- Fresh produce increased 17.2% over the comparable week in 2019.
- Frozen, +43.1%
- Shelf-stable, +32.9%
Source: IRI, Total US, MULO, % growth vs. year ago week ending April 26, 2020
Fresh Produce
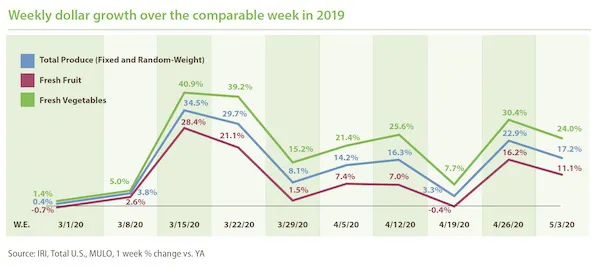
Compared with the same week in 2019, fresh produce generated an additional $205 million in sales during the week of May 3. Growth rates were in line with the levels seen during late March and early April. Fresh vegetables, at +24.0%, continued to easily outperform fresh fruit and boasts double-digit increases for seven out of the last eight weeks.
Jonna Parker, Team Lead, Fresh for IRI said: “Grocery stores have greatly increased their share of fresh dollars in recent weeks, jumping from 60.2% the week of March 8 to 64.2% the week of April 12, for instance. Likewise, after a few years of stagnant engagement, grocery e-commerce jumped years ahead on its growth trajectory. In a way, it is 2025, now.” IRI data shows that fresh foods have enjoyed double- and triple-digit growth in weekly spending versus year ago since the week of March 8. Since the week of March 15, fresh e-commerce gains versus last year did not drop below +68% and peaked as high as +105%.
Fresh versus frozen and shelf-stable
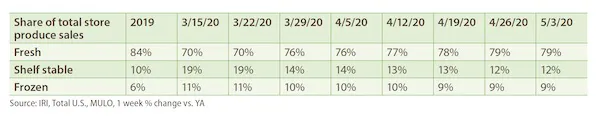
Percentage-wise, gains in fresh produce are bound to be lower than frozen and shelf-stable due to its share of total produce. The shares across fresh, frozen and canned during the first week of May were unchanged versus the prior week. The majority sales share, 79%, is generated by fresh, but both canned and frozen remained elevated versus 2019 levels.
Dollars versus Volume
The volume/dollar gap widened the week of May 3 to 3.7 percentage points, up from 2.7 points. However, this is much diminished from the week ending April 22, when the volume/dollar gap was 8.9 percentage points.
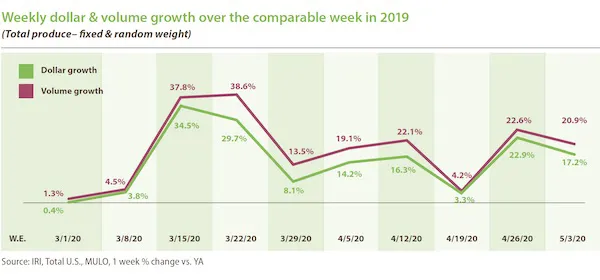
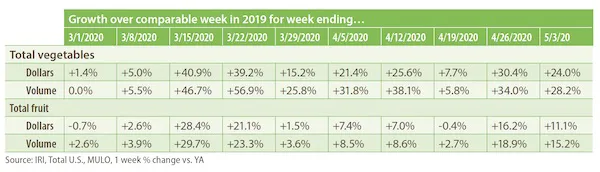
Both vegetables and fruit saw volume tracking ahead of dollars the week of May 3 versus the comparable week in 2019.
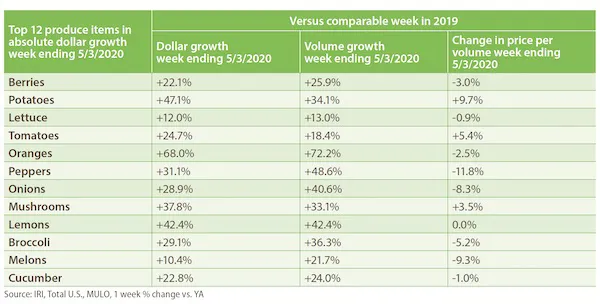
The top three growth items in terms of absolute dollar gains over the same week in 2019 were berries (+$30 million), potatoes (+$23 million) and lettuce, +$18 million. However, at the category level, big differences continued to exist between dollars and volume, driven by deflationary pressure. Within the top 10 growth items in absolute dollars, significant volume/dollar gaps remain for items, such as peppers, onions and melons.
“On the fruit side, we saw significant difference in dollar growth versus volume growth for items such as pineapples (30 percentage point gap), avocados (18 points) and melons (11 points) this week,” said Watson. “By and large, these gaps are driven by deflationary pressure on the price per volume. Thinking about entering watermelon season, it is great to see strong demand, up nearly 22% over last year, but the price per volume being down nearly 10% over last year is affecting dollar gains.”
On the vegetable side, onions had a strong 28.9% boost in dollars, but volume sales were up 40.6%, with the retail price per volume down more than 8%. Others with high dollar/volume gaps were celery (30 percentage points), peppers (18 points) and Brussels sprouts (15 points). On the other hand, we saw some upward pressure as well for other items, particularly potatoes, with dollar sales still going strong, at +47.1%, and volume up 34.1%. Average price paid (dollars divided by volume) for potatoes was 9.7% higher versus the same week last year.
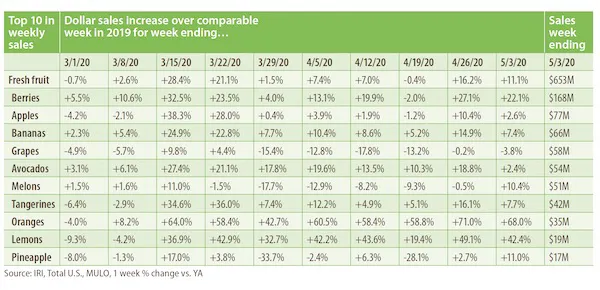
Fresh Fruit
The top 10 items in terms of dollar sales saw double-digit increases for six during the week of May 5 versus the comparable week in 2019.
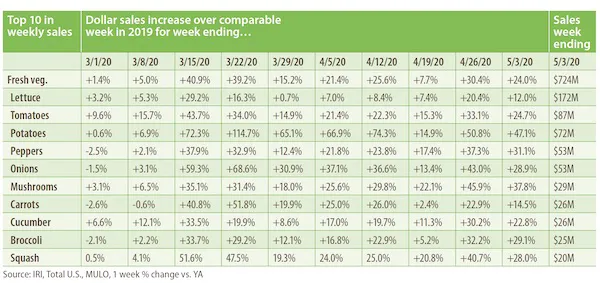
Fresh vegetables
All top 10 vegetable items in terms of dollar sales gained double digits the week ending May 3, with increases ranging from +12.0% for lettuce to +47.1% for potatoes.
Lettuce was the top sales category, but potatoes were the top contributor in absolute dollar growth in vegetables, adding $23 million in sales versus the comparable week in 2019.
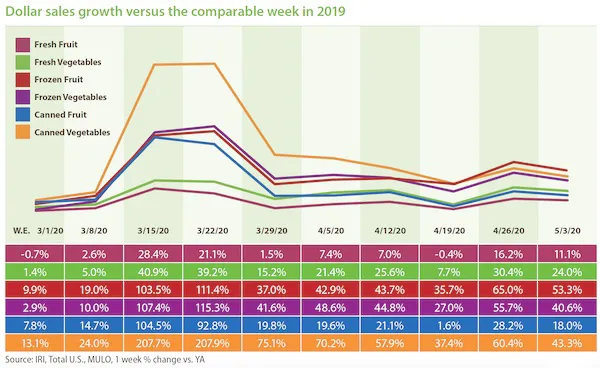
Fresh Versus Frozen and Shelf-Stable Fruits and Vegetables
Consumers continued to split their fruit and vegetable dollars three ways during the week of May 6. In addition to the strong performance of fresh vegetables, frozen and canned vegetables had ongoing strong growth during the first week of May as well. This was the third week where frozen fruit sales outpaced gains in frozen vegetables since the week of March 15.
 For more information:
Anne-Marie Roerink
210 Analytics
Tel: +1 (210) 651-2719
Email: aroerink@210analytics.com
www.210analytics.com