Global trade in top fruit
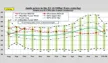
The distribution of the export market has been fairly stable between 2009 and 2013. The countries with the largest share of top fruit exports are the United States, China and Italy, each with a share of between 10 and 20 percent. These are followed by Chile, Argentina, South Africa, New Zealand and Western Europe with a share of up to 10 percent. Additionally, some minor and temporary shifts are visible. In 2010, Syria and Iran appear in the list of countries with a market share of less than five percent. Two years later, the share of these countries dropped to less than one percent.
More interesting are the growth rates of exporting countries compared to the previous year. Where the charts showing market shares remain fairly stable, those with changes in exports tend to vary from year to year. What strikes us first is that the biggest top fruit exporters representing a stable market share, don’t show any big changes year by year. Where the export of China in 2010 grew by about 20 percent and the United States by 14, there are many countries that demonstrate a single strong growth of over 100 percent. Countries in Africa, South America, India, Scandinavia and Eastern Europe typically show extreme growth rates, only to display significantly lower rates a year later.
On the import side, Russia has the largest market share of 10 to 20 percent. This share has remained stable in recent years. The Netherlands, Germany and Great Britain follow with a share of 5 to 10 percent. Over the past five years, no clear trend of growth is visible, Asia being a prime example of muted growth. Market shares in the value of imports remain relatively stable.
The changes in import value likewise show substantial differences per year. Until 2013, the import value of Russia grew by 10 to 50 percent per year. In 2013 itself, the import value decreased by 5 percent compared to 2012. What is striking, is that few other countries show a steady growth. Typically, a country will display impressive growth in one year, only to show considerable decline the year following.
Interestingly, many countries in Asia, Africa, Oceania and South America grow by 20 percent or more. In particular are Costa Rica, Chile, Saudi Arabia, Syria, Armenia, Moldova, Nepal and South Korea: all doubling the import value of top fruit compared to 2009. Smaller growth rates of only 10 percent or less are visible in Western Europe and North America.
The growth in Africa and South America is levelling off. Eastern Europe and Asia maintain a growth of more than 20 percent down. Again, the import value of Chile and Armenia is growing by more than 100 percent, as is that of Mozambique, Nigeria, Tunisia, Georgia and Hungary. Small growth and decline are found in Western Europe and America.
South America returns as a growth region. Newcomer with growth rates above 20 percent is West Africa, other prominent emerging countries with more than 20 percent are Mexico, Canada, France and Ireland, mostly located in regions that barely showed growth in the previous years. The growth in Chile is slowing, but manage to remain above 20 percent. Uruguay, Venezuela, Ukraine and Japan are four countries that have more than doubled import values.
Compared to previous years, a clear shift can be seen, as South America, Asia and Africa show a strong decline in import value, while North America and Western Europe managed to boost their growth rates by at least 10 percent. In addition, Southeast Asia and Oceania show a slight growth. Three countries have grown by more than 100 percent, namely Mozambique, Georgia and Switzerland.
Changes in the value of exports in 2010 compared to the previous year are remarkable. Many countries saw their export value increase by more than 100 percent, some grew by over 20 percent, while the bulk of the countries stayed under 20 percent. The fastest growers include: Peru, Colombia, Costa Rica, Dominican Republic, Ivory Coast, Namibia, Morocco, Tunisia, Yemen, India, Nepal, Taiwan, Kyrgyzstan, Georgia, South Eastern Europe and Scandinavia.
A major shift was recorded in 2011, with significantly less growth rates above 100 per cent over the previous year. Eastern Europe and Russia were able to chalk down large growth rates, as well as some African countries. In the north of South America and across Asia, some countries continued to grow by more than 100 percent.
A remarkable shift yet again: the map turns yellow instead of blue, which means that many countries were able to realize a growth of 20 percent or more. North America, Russia, Brazil, Australia, North Europe and Scandinavia, these figures show. Large growers with more than 100 percent are Norway, Finland, Georgia, Vietnam, Thailand, Tanzania, Zambia and Morocco.
The growth in export value of North America is levelling off, Canada even sees the value decrease compared to 2012. Europe also turns blue again, which means a reduction of the export value. Brazil, Southern Africa, Southeast Asia, India and Russia show a growth of 20 percent or more. There are noticeably less red countries on the chart. Only Sweden, Morocco, Tunisia, Togo and Uganda show large growth rates.