CropScape is a public user interface for a national land cover geospatial data product called Cropland Data Layer. The National Agricultural Statistics Service released the latest annual CDL at 30 meters resolution on Feb. 5, 2020. The entire archive of historical CDL products are available on CropScape to browse, interact, visualize, download, and query the CDL dataset without needing specialized software tools.
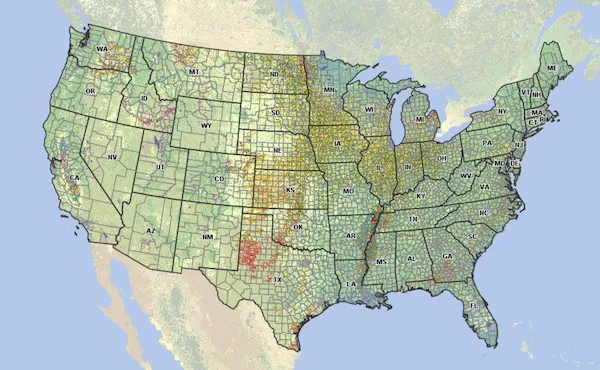
CropScape is a powerful tool that visually displays where food and feed crops are grown. With a quick scan of the U.S. map, users can easily see swaths of green and yellow showing field corn and soybean acreage across the Midwest. If users zoom in around Des Moines, Iowa they can also see smaller plots of alfalfa, oats, and other hay.
Similarly, when looking at California, which is known for growing a vast array of food crops, one sees a large area of many colors, with blocks of blue, which is rice. When the user zooms in, they can identify dozens of other crops including grapes, almonds, and tomatoes.
To explore what’s grown in a specific area, use the “drag box zoom” tool and then click the “query” tool and select a color to identify the crop. To find the data behind the colors, use the “define area of interest” tool to outline the area of interest, then select the “area of interest statistics” tool and the available crop acreage data from the CDL will display. The user can then export or display the data in different ways.
The CDL product uses satellite imagery collected from six different satellites throughout the growing season to monitor growing conditions over the continental United States. The CDL contains more than 110 agricultural classes showing where crops were planted.