An article published on Foodlog under the headline "Failing grade for Trump's agricultural policy" reports a negative trend in U.S. agricultural trade. Measured in dollar value, the United States exported more agricultural products than it imported up to and including 2022. Since then, imports have exceeded exports, with the gap continuing to widen in the most recent reporting period.
Based on trends through September, U.S. agricultural imports in the past year are estimated at around USD 220 billion, while exports reached approximately USD 176 billion. Imports continued to grow, while exports remained broadly at the same level as the previous year.
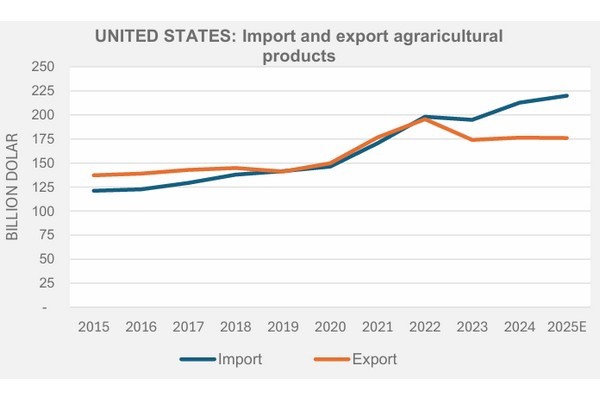 © Jan Kees Boon
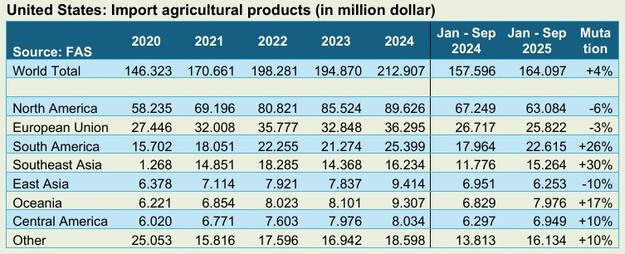
Most imports from neighboring countries
The United States sources a large share of its agricultural imports from neighbouring countries, Mexico and Canada. In 2024, imports from these two countries amounted to nearly USD 90 billion out of a total agricultural import value of USD 213 billion. Mexico was the largest supplier, with close to USD 50 billion, followed by Canada at around USD 40 billion. While total U.S. agricultural imports increased by about 4% in the most recent year, imports from Mexico and Canada declined by approximately 8% and 4%, respectively.
The European Union is the second-largest regional supplier of agricultural products to the United States. In 2024, imports from the EU totalled around USD 36 billion. In the most recent year, this figure declined by roughly 3%. Italy is the largest EU supplier, with USD 8.5 billion in exports to the U.S., followed by France at USD 6.5–7 billion and Ireland at nearly USD 6 billion. Imports from the Netherlands exceeded USD 3 billion, showing growth of around 5%.
South America is the third-largest region of origin. Imports from this region increased strongly in the most recent year and are expected to exceed USD 30 billion, with Brazil as the main supplier.
South and East Asia are also important sourcing regions. China remains the largest supplier within this group, although imports of Chinese agricultural products declined sharply. This decrease was offset by strong growth in imports from countries including Indonesia, Thailand, India, and Vietnam.
 © Jan Kees Boon
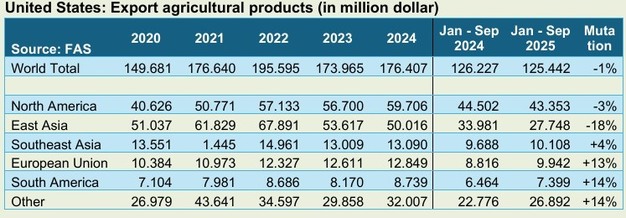
Export to the EU has grown
On the export side, Mexico and Canada are the main trading partners of the United States. Each country takes about $30 billion in U.S. agricultural products. In 2025, there was a slight growth in exports to Mexico, while exports to Canada declined by about 5%.
China was long on its way to becoming an equally important customer, but exports to China fell sharply in 2024, followed by a further decline in 2025. On the other hand, there is a clear growth in U.S. exports of agricultural products to the European Union and various countries in Southeast Asia.
 © Jan Kees Boon
Beer from the Netherlands
U.S. agricultural imports are primarily products for direct consumption, including grains, pasta, vegetables and fruit, meat, and distilled spirits. Imports of agriculture-related products such as fish and forestry products are also significant, as is the import of intermediate goods like vegetable oils. By contrast, imports of bulk agricultural commodities remain relatively limited.
From the European Union, the main products imported into the United States are wine, distilled spirits, dairy products, pasta, and processed fruit and vegetables. Beer is the most important agricultural product exported from the Netherlands to the United States.
Nuts and Soy to the EU
On the export side, products for direct consumption are also the most important. Key export products include beef, nuts, pork, and dairy products. In addition, the United States exports large volumes of bulk commodities such as soybeans and maize. Exports to the European Union mainly consist of nuts and soybeans.
Click here for background information.
For more information:
Jan Kees Boon
Fruit and Vegetable Facts
[email protected]
www.fruitandvegetablefacts.com