The major service disruptions due to the round-of-Africa routing naturally leads to the question of how this has impacted deployed capacity. Using their Trade Capacity Outlook database, Sea Intelligence looked at the differences in offered capacity between the immediate pre-crisis and the present situation.
The figure below shows, for each of the four major East/West trades out of Asia, the cumulative change in offered capacity over the fill period from mid-December to the present date. We have deliberately not included future capacity as this would overlap with Chinese New Year effects. The cumulative changes up to the present date would therefore more ‘cleanly’ represent the Red Sea impact.
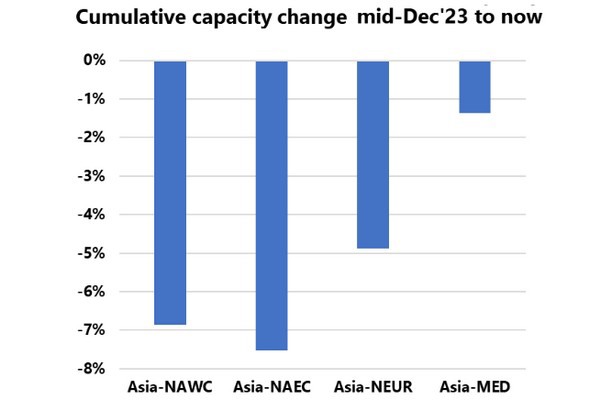
The interesting element here is that the largest capacity contraction, compared to planned deployment in mid-December, has been seen on the Transpacific trade, with the Asia-North America East Coast trade lane down -7.5% and the Asia-North America West Coast trade lane down -6.9%. Conversely, the capacity impact on the Asia-North Europe trade lane has been a contraction of -4.9% and on the Asia-Mediterranean trade lane, of only -1.4%.
What this shows is that despite the extreme upheaval in the vessel schedules, the capacity offered from Asia to Europe has only been reduced quite marginally because of the Red Sea crisis. The capacity reduction here measured is not measured Y/Y, but of the planned schedules in mid-December versus what has materialised until now. Curiously, as shown in Figure 1, the impact on the Transpacific is larger, and it is particularly interesting to see the capacity drawdown on Asia-North America West Coast.
For more information: sea-intelligence.com