The demand and supply of table grapes globally continues to be on the move. "The total table grape export landscape is becoming more dynamic, with some regions expanding their shipments while others show a clear downward trend," reports the new report, Table Grape Update 2025 from Rabobank.
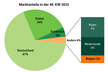
Overall, the report indicates that global exports reached a new high of 4.6m metric tons for 2024-2025–a 10 percent increase over 2023-2024. However that is only a 0.5 percent over the 2021/2022 record. This development is largely driven by growth from top exporting countries of Peru and China who together, represent 28 percent of total exports. "This is a recovery from 2023 when Peru was impacted by El Nino. 2024-2025 was back to a normal year and now clearly Peru is the largest exporter of table grapes in the world. In the past two to three seasons, it's been fluctuating between Chile and Peru," says Rabobank's senior analyst fresh produce David Magaña and co-author of the report.
On imports, the report notes that global table grape imports totaled 4.4m metric tons in 2024 which is equivalent to 537m boxes. "This reflects reduced shipments from Peru during the 2023/24 season, along with declines from Spain and Turkey," notes the report.
Meanwhile, Southeast Asia is emerging as an attractive market. "The largest destinations for table grapes are Europe and the U.S., which are more mature markets. Emerging markets will be the driving force for growth," says Magaña.
Indeed together, the EU and the U.S. account for 43 percent of global volume and imports in these markets have grown steadily at an annual rate of 2 percent over the past decade. On consumption, per capita consumption in the U.S. sits at an average of 8.2 lb./person/year over the past decade and that figure is likely to reach 9 lb./person/year in 2025/2026.
 © Rabobank
The United States
Table grape exports from the U.S. are stabilizing, albeit with strong growth to fellow North American markets. Particularly Mexico, which is seeing table grape retail expansion and promotional efforts. Together, in 2010, exports to Canada and Mexico totalled 127,500 tons and accounted for almost 40 percent of U.S. exports. By 2024 though, that volume surpassed 150,000 metric tons and represented 67 percent of U.S. exports. Current U.S. table grape exports are two-thirds of the amount reached in 2010 and just over 50 percent of what was reached in 2013. As for 2025, modest increases in exports are expected.
Over the past decade, exports to Asian markets have also significantly declined including to China/Hong Kong, Indonesia, Philippines, Malaysia, Thailand and Singapore. "China/Hong Kong have the same exporting season. They ship year-round but their peak has a big overlap with the U.S. and the U.S, is relying more heavily on going into Mexico and Canada," says Magaña. Overall, U.S. table grape exports have shrunk from 40 percent a decade ago to 30 percent in recent years. That's expected to continue.
However, imported grapes account for around 60 percent of U.S. consumption and that figure has increased by more than 40 percent in volume over the past decade. Between January 2023 and July 2025, imports from Chile accounted for 37 percent of U.S. table grape imports, followed by 34 percent from Peru, 27 percent from Mexico, and two percent from other origins, including Brazil and South Africa.
Mexico
Mexico has steady demand for table grapes from the U.S. along with its domestic markets. In 2025, the Sonora estimate was for 23 million boxes–a one percent year on year recovery but down nine percent from the multi-year high in 2023.
As for 2025 exports to the U.S., which account for 99 percent of Mexican table grape exports, they declined by about 10 percent year over year (YOY) according to the USDA. However, the domestic market accounted for about 4 m boxes, which is a higher volume than previous seasons.
 © California Table Grape Commission
Peru
Notably, Peru has overtaken Chile as the top global table grape exporter and has been the top exporter by volume in 2022/23 and 2024/25. Magaña expects the country to remain the top global exporter for the next three seasons.
However, the planting rate has slowed to a compound annual growth rate (CAGR) of three percent over the past five seasons and that's reflected in the four percent export growth projected for 2025-2026. "While the planted areas are still expanding, Peru continues to change varieties too for varieties that offer a combination of higher yields and more consistent quality," says Magaña.
Its export certified area has grown by 52 percent over the past decade to reach 23,300 hectares. That acreage is expected to continue expanding in both Peru and Brazil.
Brazil
Brazil is now the third largest exporter of table grapes in the South American region. It saw a slight decline in volume but increased unit export value by 28 percent over the past five seasons.
Chile
Unlike Brazil and Peru which continues to expand export acreage, Chile is more focused on replanting efforts. 2022-2023 marked Chile's lowest production in 24 years while in 2025/2026, Chile expected to see modest increase in table grape production.
 © PROVID
China
China is fast gaining ground as an exporting country and could be the top exporting country by the end of the decade. "China is transitioning from being a net importer to being a net exporter, particularly to the South Pacific/Asia Pacific markets," says Magaña. Indeed, while in 2025, global table grape exports to China and Hong Kong reached 118,000 metric tons which is the lowest level since 2010/11, the country accounts for almost 50 percent of global supply.
Between 2020-2025, Chinese table grape exports increased significantly in the first half of the year–the report notes that this indicated greater domestic availability during a period traditionally dominated by counter-seasonal suppliers such as Chile and Peru.
As for where exports are destined to, a decade ago exports were heavily concentrated in Thailand, Vietnam and Indonesia which accounted for 78 percent of the total. That figure dropped to 62 percent by 2024 as new Asian markets have emerged.
Though the Southeast Asian markets are where demand for higher quality grapes is picking up and Asia Pacific countries are expected to represent 65 percent of the global middle class by 2030. "Some countries, for example Indonesia, have a sizable population but low per capita consumption. Since China is exporting now and they also have these good quality proprietary varieties, there's potential to create year-round demand for table grapes that we haven't seen in many of these emerging markets," says Magaña.
In varieties, China's production and exports are now centered around a few successful varieties, with the top being Shine Muscat. This is a change from when Red Globe was once the dominant variety–it now makes up only 12 percent of imported supply, indicative of that demand for higher quality grapes.
South Africa
Exports in 2024-2025 reached a record high of 350,000 metric tons, though over the past 10 seasons, there has been a sharp decline of 51 percent to Asia. However there has also been a significant increase in exports to North America of +581 percent.
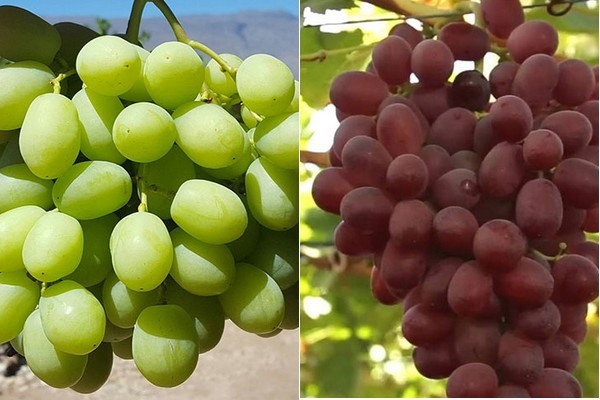
In varieties, green seedless table grapes have seen the fastest and most volume growth over the past 10 seasons and it's expected to become the country's leading export variety in the next season.
 For more information:
Melanie Bernds
Rabo AgriFinance
[email protected]
https://research.rabobank.com/