Even with historically low schedule reliability in 2021, there were 3 deep-sea services that had 100% schedule reliability across the entire year. In fact, roughly 11% of the deep-sea services were at 70% or higher. What this means, is that even in the most trying of times, shippers can find those marginal gains in ocean reliability. In issue 611 of the Sunday Spotlight, we looked at how big those marginal gains could have been, if shippers modelled their service selection based on historical schedule reliability. This of course is a simplistic approach, as supply chains are often not agile enough to make such short-term changes.
Taking Shanghai to Los Angeles/Long Beach as a proxy for Transpacific, the figure below shows the relative improvement in schedule reliability, had shippers shifted cargo to the service with the highest reliability in the past month. This improvement is against having moved all of their cargo on either one of the three carrier alliances or having split it evenly across the three alliances.
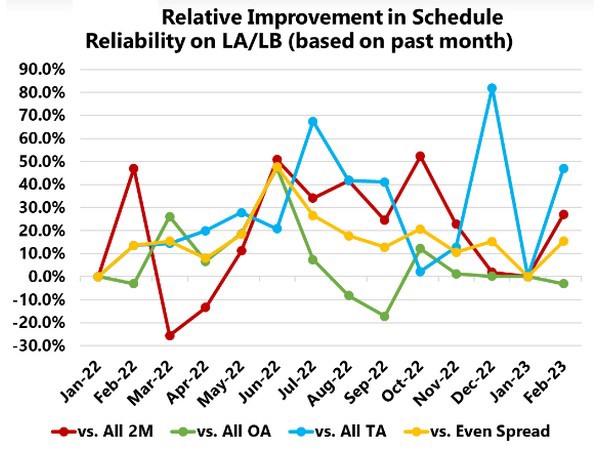
While there are no doubt shippers would have netted higher reliability having used this approach, what is interesting here, is that the improvements are not linear and there is a lot of volatility from one month to the other. However, across the 14-month period, using this approach would have netted an average 19.6 percentage points (PP) increase over shipping entirely with 2M, an average 6.3 PP increase over shipping entirely with Ocean Alliance, an average 27.9 PP increase over shipping entirely with THE Alliance, and an average 15.9 PP increase over an even cargo split across the three carrier alliances.
Despite the volatility, the average higher net schedule reliability is quite substantial. This means that using historical schedule reliability could be a really powerful tool to help shippers improve received reliability.
For more information: sea-intelligence.com