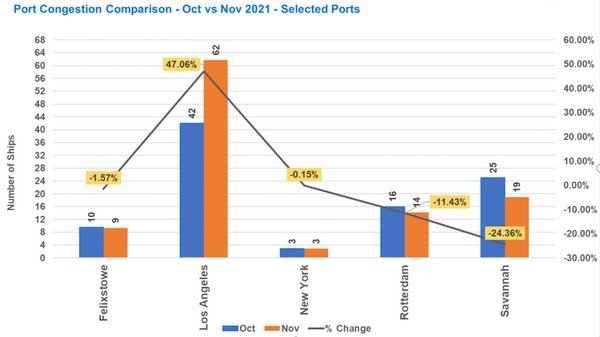
Port congestion has become an increasingly serious problem in the past few months. The chart below shows how it has impacted five key ports.
Although the situation is improving somewhat in Britain’s No. 1 container port Felixstowe, in Rotterdam, Europe’s leading container port, and in Savannah, one of the most important ports on the US East Coast, congestion is still particularly bad at the US port complex of Los Angeles/Long Beach, which accounts for 40 percent of US imports.
The North America West Coast congestion problem was exacerbated by severe flooding that cut all major road and rail links between the Port of Vancouver and inland destinations in Canada and the US in mid-November. The resulting congestion in this port meant it made no sense for vessels heading from Asia to the West Coast of North America to re-route to Vancouver.
Container dwell times
Export and import container dwell time data for November 2021 revealed improvements in over 50 percent of the ports tracked compared to October 2021.
Except for Vancouver (for reasons explained above), export container dwell times fell by three days in the major ports of Felixstowe, Yantian by two days, and Hong Kong and Savannah by one day.
Four ports saw import container dwell times fall between October and November: Felixstowe by two days and Hong Kong, Shanghai, and Yantian by one day. Here, too, the exception to the rule was Vancouver.
However, with the exception of Shanghai, export container dwell times in all these ports were higher than import container dwell times, and in some cases, the export figure was more than twice as high.
Container rollovers
Container rollovers happen for a variety of reasons and the numbers depicted are not necessarily a reflection of the quality of a specific carrier’s or port’s operations.
In October and November, all major transhipment ports displayed high levels of rollovers. This may be linked to the blank sailings that may have been caused by berthing congestion across ports worldwide. What is clear from the data collected throughout 2021 is that there was an overall upward trend in rollover percentages January-September.
Outlook
Although new Covid outbreaks in Europe threaten return-to-normal consumer purchasing patterns, most economists and industry leaders anticipate a drop in consumer goods demand following peak 2021 retail season. China will also shutter manufacturing for two weeks starting in February to celebrate Lunar New Year. With looming inflation, record-high household debt in the U.S. and consumer sentiment falling to its lowest level in a decade, continued strong demand for goods into 2022 doesn't appear likely.
For the full report, click here.
Disclaimer: The data referenced is sourced from project44’s freight visibility platform, based on the logistics indicators tracked. The sample data sets referenced do not include all freight movement data tracked by other entities. Data from project44’s platform reflects a statically significant sample size to draw conclusions.
 For more information:
Charlie Pesti
charlie@pesti.io
https://www.project44.com