November 2021 picked up where October left off: grocery shopping and food consumption patterns remained in flux, especially as holiday purchases started much earlier. IRI, 210 Analytics and the Produce Marketing Association (PMA) have teamed up since March 2020 to document the changing marketplace.
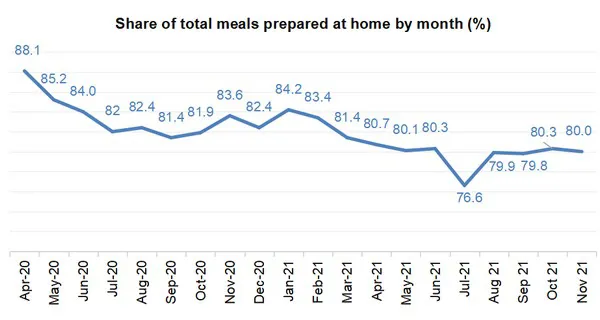
While retail prices for most categories rose to their highest point in many decades, the cost for eating out rose even faster. Restaurant inflation typically results in more at-home meal preparation but those levels have already been elevated since the onset of the pandemic.
Year-to-date sales
The first 11 months of 2021 brought $633 billion in food and beverage sales —up 1.3 percent over 2020 . However, inflation played a significant role with year-on-year unit sales still down 3.5 percent.
Perishables, including produce, had the highest year-over-year growth during the first 10 months of 2021 at +1.8 percent.
Inflation
Fresh produce prices are also higher than last year. Year-to-date, prices for total fresh produce are about 6 percent higher than they were last year. Inflation for fruit is above average at +8.2 percent year-to-date through November 28. Fruit prices during November 2021 were 11.9 percent higher than in November 2020. “Supply chain challenges continue to affect fresh produce pricing and availability,” said Joe Watson, VP of membership and engagement for PMA.
Week-by-week sales fresh produce
Fresh produce sales were very consistent with November levels between $1.2 and $1.4 billion each week. Sales exceeded last year’s levels by 4.0 percent.
Fruit sales growth slowed a little to +8.5 percent versus November 2020, but gains remained more than 18 percent ahead of the pre-pandemic 2019 levels. Vegetable sales were 14.1 percent ahead of 2019 — for a total department gain of 16.0 percent.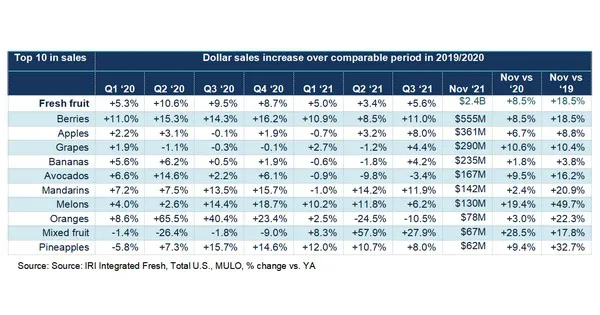 Produce sales in November
Three items in fresh fruit reached double-digit gains: grapes, melons and mixed fruit. Grapes had mostly a flat year in 2020 but sales have been accelerating since the third quarter of 2021.
Citrus have a big representation between mandarins and oranges. Lemons fell just outside of the top 10 with $62 million and a gain of 3.3 percent versus 2020.
“Looking at the top 10 in vegetable dollar sales conjures up Thanksgiving dinner,” said Watson. “Between potatoes moving in first place, onions and carrots having a big month and celery moving into the top 10, the holiday had a big impact on fresh vegetable sales this November. Sales increased versus year ago, with the exceptions of tomatoes, peppers and mushrooms, which each had a strong 2020.”
The next report will be released in mid-January. Please click here for the full report.

For more information:
Anne-Marie Roerink
210 Analytics LLC
Tel: +1 (210) 651-2719
aroerink@210analytics.com
www.210analytics.com