Truckload rates hit new highs and freight volumes remained elevated in July but retreated from June’s record levels, as shippers paid a premium for transportation amid pandemic-related supply chain disruptions. 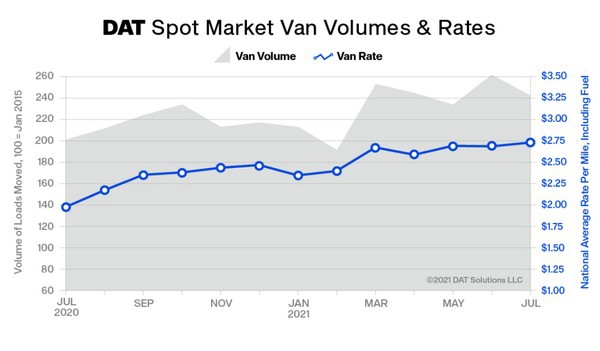
The DAT Truckload Volume Index was 222 in July, down 8% compared to June. The Index is an aggregated measure of dry van, refrigerated (“reefer”) and flatbed loads moved by truckload carriers and an industry-standard indicator of commercial freight activity. A baseline of 100 reflects freight volume in January 2015.
“Shippers not only experienced escalating spot and contract rates in July, they were hampered by port congestion, unloading delays, shortages of trucks and drivers and more recently tighter intermodal capacity,” said Ken Adamo, Chief of Analytics at DAT. “With holiday merchandise already arriving at ports, for many shippers there is more freight than the commercial transportation system has the capacity to handle efficiently. All modes are under stress.”
Spot van, reefer rates hit new highs
- The national average spot rate for van loads on the DAT One load board network was $2.73 per mile, up 5 cents from June and 70 cents higher year over year (all rates include a fuel surcharge). The average is 28 cents higher than November 2020, when holiday freight volume was peaking.
- The national average spot reefer rate rose 4 cents to $3.14 per mile, a new all-time high. The reefer rate has increased from June to July only once—in 2020—since DAT established the Index in 2010. Since 2015, the average spot reefer rate has fallen an average of 6 cents from June to July.
- The national average spot flatbed rate fell 3 cents to $3.12 per mile, in line with seasonal expectations.
August outlook
West Coast port markets are driving demand for truckload services. Ships continue to bunch up outside the ports of Long Beach and Los Angeles, where about one-third of all container imports arrive.
The average outbound spot van rate from Los Angeles was $3.70 per mile at the beginning of August, up roughly 2% during July. Los Angeles to Phoenix, a key warehouse and distribution market for retailers, averaged $4.61 a mile during the first week of August, $1.88 higher than the national average for spot dry van freight.
The ongoing chassis trailer shortage has been exacerbated by higher-than-normal dwell times for local container delivery and intermodal rail cars to move containers from West Coast ports to inland destinations. Shippers are turning to the spot market for capacity: the number of dry van loads moved from Los Angeles to Chicago soared nearly 40% over a four-week period starting July 3.
For more information:
Annabel Reeves
DAT Freight & Analytics
Email: Annabel.Reeves@dat.com
Tel.: +1 503-501-0143