A positive trend was registered at the Parma Food and Logistics Centre (CAL). Director Giulietta Magagnoli and the office for statistics have processed the data from which emerged a successful sales trend in the first 5 months of 2020.
"The total volume of incoming goods towards the Parma agri-food center - explained the director - turned out to be similar over the two-year period, and at times even overlapping. The chart shows the stability of the market, despite the emergency and the restrictive measures imposed by the government on the market system, such as the closure of street markets and other limitations."
"The trends are particularly interesting, as they show a significant increase in 2020 compared to 2019, and reveal unexpected results in a year so profoundly marked by complications. Finally, the chart shows the average daily workload of each dealer operating in the market."
 Giulietta Magagnoli
The CAL records the amount of goods destined for each individual dealer through the number of documents that are scanned every day. "Thanks to these records, we have implemented a monitoring system that makes it possible to evaluate the trend of incoming goods and compare the volumes for specific time frames. This system allows us to compare, for example, the deliveries of a given month with the quantities of the same period recorded in the previous year."
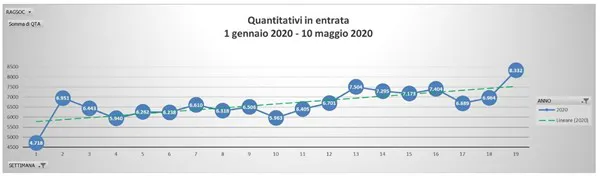
The following chart shows the trend of the quantities entering in the period considered. The blue line outlines the quantities arriving on time, the green line outlines the trend. Before comparing the trends of the quantities in the period 2020-2019, one must bear in mind that the CAL, has undergone some changes during the period due to the exit of two dealers and acquisitions of companies. To date, one stand that was occupied in 2019 is still unoccupied.
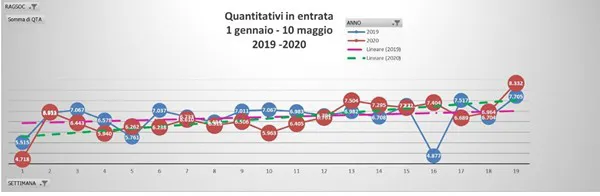
For this reason, before any comparison of trends, we proceeded to analyze the data continuously over the two-year period. The data, however, covers 96% of the total quantity, which is therefore absolutely representative of the trend under analysis.